
Is your fleet focused on specific driving routes that are on dangerous roadways?
Reducing insurance costs requires looking at your operation the way an underwriter does. To an underwriter, finding the amount of risk your fleet faces is their entire job and is what affects your commercial insurance rates.
Underwriters look at many different risk factors and data provided to establish the potential risk levels and determine your insurance score. The most common areas that hurt a carrier’s safety history are any professional, personal, and financial issues that underwriters have access to that show high risk.
However, underwriters also look at the location of frequent routes your drivers travel.
In trucking and transportation, hazardous areas present a significant risk to professional drivers and motor carriers.
Insurance companies are big fans of regular routes as it lowers the overall risk of an accident because the more regular routes you operate in, the more familiar your drivers are.
However, the location of these frequent routes could negatively affect your risk as well.
How does route location affect a company’s’ risk and insurance rates?
Trucking is dangerous because drivers must deal with distracted drivers, crumbling infrastructure, and congested roads across the U.S.
Underwriters use road safety data that highlight the more dangerous roadways to map out which states, metropolises, and cities are the riskiest to travel in.
For example, DOT’s National Highway Traffic Safety Administration releases data each year on motor vehicle traffic deaths. In 2018 and 2019, the top 5 states for motor traffic deaths by state was California, Texas, Florida, Georgia, and North Carolina.
One-half of the top ten trucking accident factors can be tied to location. These factors include:
- Traffic flow interruption and congestion
- Traveling too fast for conditions
- Unfamiliarity with roadways
- Roadway problems
- Missing required stops
According to a recent TRIP report, California tops the list of congested urban interstates, while Nevada holds the number one spot with the most significant increase in vehicle miles of travel (VMT).
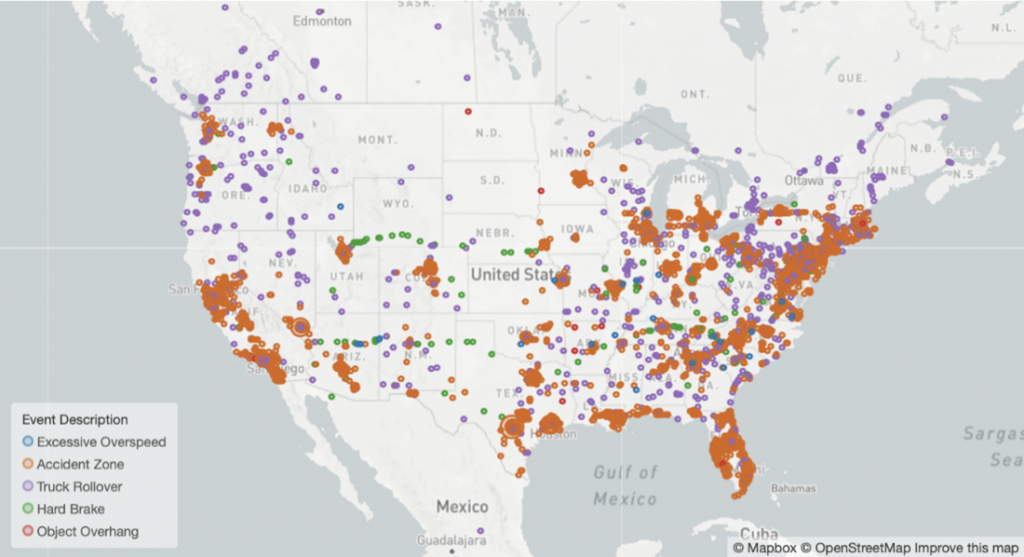
Omnitracs data reflects this in their live map of the U.S. that shows the most dangerous locations for commercial vehicles based on aggregated customer and third-party data.
The initial data shows that the most hazardous locations are in the Mid-Atlantic, Northeast, Florida, and Texas.
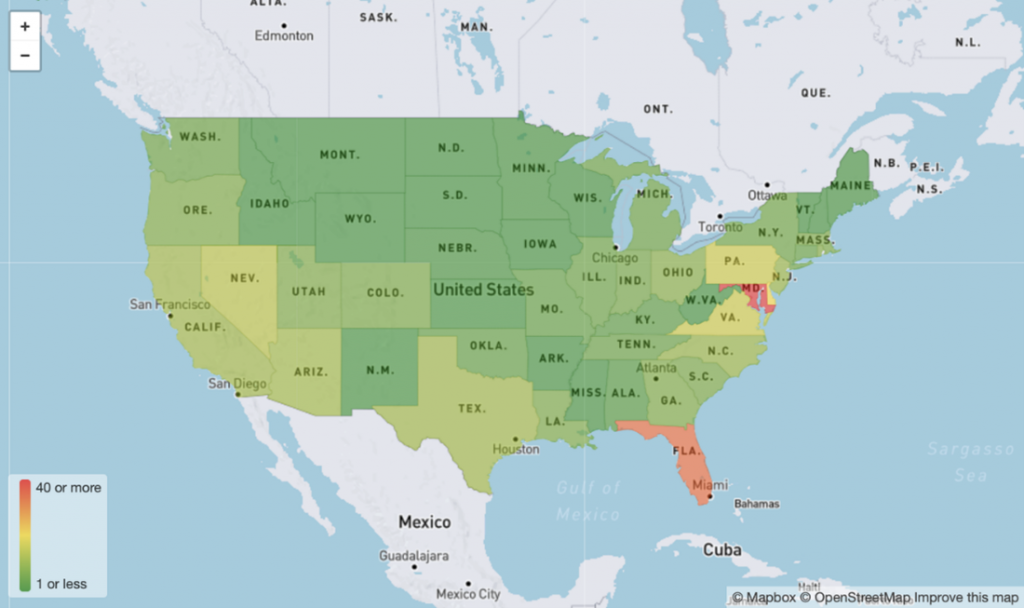
That heatmap below shows that Maryland has about 40 hazardous locations per 1,000 state road miles with Florida the next most hazardous. The Omnitracs data goes further, showing that Baltimore alone has 876 hazardous areas, most of which are accident zones.
Virginia and Pennsylvania are also among the most hazard-dense states for drivers along the East Coast while Nevada has the most hazardous locations per 1,000 miles on the West Coast.
Underwriters know that due to the associated issues related to dangerous locations, drivers are more likely to exhibit high-risk driving behaviors in these areas.
Letting your underwriter know the safer routes your drivers frequently travel will help you reduce your overall risk and insurance rates.
Are you doing everything you can to reduce risk?
If you cannot avoid these areas, how can a fleet reduce their risk regardless of which state their drivers are traveling?
Underwriters want as much data as possible to build a complete risk portfolio. Carriers can incorporate the latest industry-leading telematic and vehicle intelligence, video cameras, and more to prevent collisions.
Since most interstate trucking companies were required to add electronic logging devices (ELDs) to their trucks, their back-office management have been given an opportunity to better manage their vehicles and drivers when it comes to violations, driving habits, audits, maintenance, and more.
Many insurance companies are allowing ELD and telematic engine data to add details to a driver’s safe driving history. This includes data such as harsh braking, harsh acceleration, harsh turning, speeding, etc.
While this data is important, adding more premium insurance credits like proactive driver training adds more history to improve your insurance score.
The best-practice telematics data management plan will measure the data over time to show trends and measure results. This is as simple as a Driver Scorecard for your fleet.
ELD Data Management made easy with Driver Scorecards
With all this data and safety management in place, the final step is to pass these new insights into how safely drivers are driving to the underwriters.
How can you find the best commercial truck insurance rates?
Allow an CNS Insurance Commercial Trucking Insurance Specialist pull multiple insurance quotes for you to find the best rates.
It never hurts to get a quote and try saving money on your insurance premiums.
Give us a call anytime and we can discuss lowering your premiums or getting a quote to see where you stand.
Before we can get you an estimate, we are going to need some information.
Fill out a complete quote or quick quote to get started.
If you have any questions or concerns, please call us at 800.724.5523 or email info@cnsinsures.com.