
The American Transportation Research Institute (ATRI) released a new report yesterday analyzing trucking industry impacts from the rising costs of insurance.
The 82 participating motor carriers across all fleet sizes represented 94,555 truck tractors, straight trucks and specialty trucks with an accumulated total of 7.5 billion IFTA miles in 2020.
The report assesses immediate and longer-term impacts that rising insurance costs have on carrier financial conditions, safety technology investments and crash outcomes as well as strategies used by carriers to manage escalating insurance costs.
These strategies included:
- decreasing insurance coverage levels
- raising deductibles or Self-Insurance Retention (SIR) levels
- decreasing investments in other cost centers
However, regardless of these strategies, 90% of the carriers reported a substantial increase in premiums between 2018 and 2020.
Let’s look at these three strategies that carriers used to try to reduce insurance rates and see which ones worked for which carriers.
The state of trucking insurance today
Before we look at these strategies, let’s look at why these strategies are being used.
According to ATRI’s report, the cost per mile breakdowns show that premium costs increased across all fleet sizes, sectors, and regions of operation.
Small fleets continue to pay more than twice as much per mile in premiums as large fleets, which pay almost twice as much per mile as very large fleets.
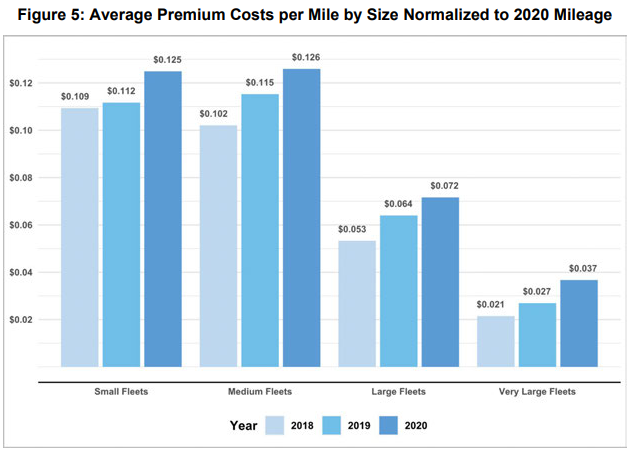
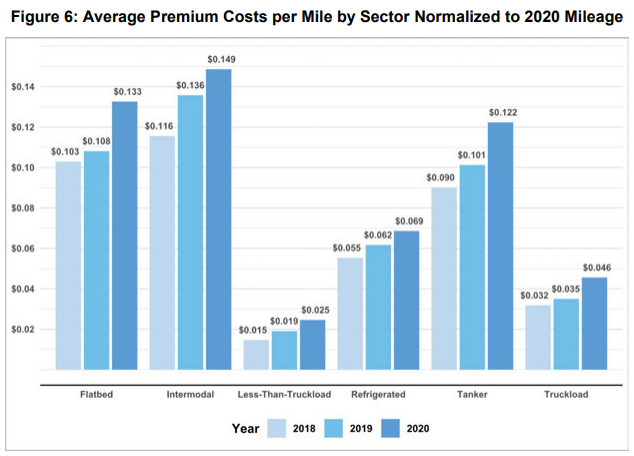
Cost per mile increases were roughly consistent across operational types except for LTL operations, which saw a 66 percent increase from 2018 to 2020.
When it comes to the carrier sectors, tankers had the highest coverage levels when averaged by IFTA mileage, a key measure of risk exposure. FMCSA requires that carriers of oil and certain types of hazardous waste meet a $1 million coverage minimum, and that carriers of other hazardous materials meet a $5 million coverage minimum.
While this requirement is five times higher than that of general freight carriers, tankers had more than seven times the excess coverage levels of LTL and truckload carriers.
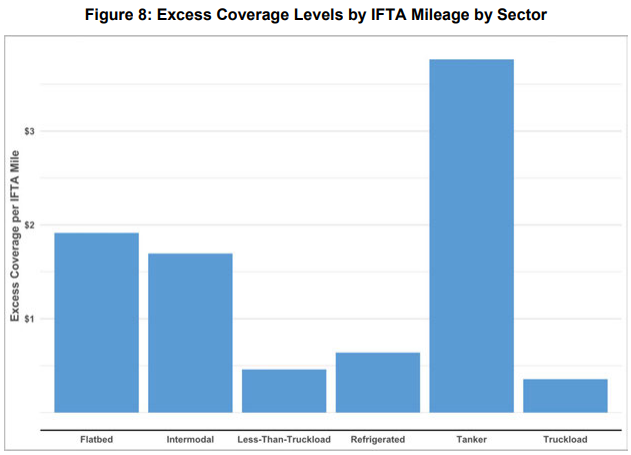
Flatbed and intermodal carriers also had considerably higher excess coverage levels on average, at roughly three times the excess coverage levels of LTL and truckload carriers.
Despite this increased liability exposure, out-of-pocket incident costs and carrier crash involvement remained stable or decreased among a majority of respondents.
Strategy 1: Decreasing insurance coverage levels
Carriers’ most common response to increasing insurance rates was to decrease coverage levels more than $1 million.
The trend toward lower coverage levels was especially pronounced among very large fleets, a majority of whom (70.6 %) cut excess coverage by 25 percent or more between 2018 and 2020. Even though the average excess coverage for medium fleets increased moderately overall, the majority of these carriers retained the same coverage levels.
However, only 14.3% of carriers that decreased coverage from 2018 to 2019 or from 2019 to 2020 successfully secured lower premiums.
The others that decreased coverage still paid higher premiums.
A slightly smaller proportion of carriers that retained the same level of coverage (12.2%) were able to secure lower premiums, presumably due to other carrier- or policy-specific changes.
It appears that decreases in total coverage levels are unlikely to lower premiums unless the decrease is substantial or occurs in conjunction with other unique carrier- or policy-specific changes.
It is important to remember, that while cutting back on excess coverage can reduce premium costs in the short run, it can also increase carriers’ exposure to nuclear verdict cases.
Strategy 2: Raising deductibles or Self-Insurance Retention (SIR)
Truckload carriers had the largest deductibles when measured as a proportion of their total coverage; their deductibles amounted to roughly 6% of their excess coverage.
By having a higher deductible-to-coverage ratio, these carriers secured lower premium costs, but in doing so they expose themselves to higher out-of-pocket costs.
Small fleets were more likely to have deductible insurance policies, and most carriers in this category maintained the same deductible levels.
SIR requires significantly greater out-of-pocket liabilities, but they allow carriers to have:
- more input in the claims resolution process
- rely more on their own performance, and
- shield carriers in part from economic fluctuations specific to the insurance industry
Most of the large fleets with an SIR had more than 500 trucks.
Of carriers that increased deductibles or SIR from 2018 to 2019 or from 2019 to 2020, only 9.5% secured lower premiums.
However, 61.1% of carriers that increased deductibles or SIR levels successfully lowered out-of-pocket costs more often than other carriers, despite their greater exposure.
A slightly greater proportion of carriers (10.8%) that retained the same deductible or SIR were able to secure lower premiums, presumably due to other carrier- or policy-specific changes.
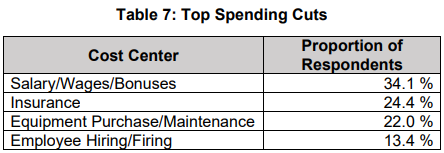
Strategy 3: Decreasing investments in other cost centers
The most common cost-cutting strategy was to reduce wages and bonuses.
Aside from insurance, spending cuts in each of these cost centers can increase a long-term savings due to consequences such as increased crashes, worsening driver shortages, or lower productivity.
Drivers ultimately remain the most important factor for ensuring safe operations. Cutting safety bonuses may also de-emphasize safety within the company culture relative to other operating concerns.
Older or poorly maintained equipment, from tires to brakes to safety technologies, can increase the probability of crashes, and negatively impact carriers’ CSA scores.
Spending cuts in these cost centers will likely be offset by increases in premiums.
Carrier-specific factors to lower insurance rates
Insurance industry experts generally acknowledge that three to five years of safety data are taken into consideration when calculating policy rates.
Carriers posing a higher risk of underwriting loss often require the maximum number of years of available loss history.
Additional carrier factors impacting insurance rates include:
- operational sectors
- cargo values
- states or regions of operation
- company growth, and
- commitment to safety culture including safety technologies
Carriers demonstrating consistent year-over-year improvements in safety technology adoption, safe driver hiring and training practices, and crash history can potentially lower their premium costs despite the current adverse environment.
Safety like road-facing cameras are valuable in litigation and are even more valuable when used proactively as part of ongoing, dynamic driver coaching programs.
Need a Commercial Truck Insurance Quote?
The worst situation to be in is getting bad commercial truck insurance coverage and being committed to it for a year when one accident can ruin your business.
We recommend you start a custom quote online or call us directly to speak with a licensed trucking insurance professional.
Before we can get you an estimate, we are going to need some information.
Fill out a complete quote or quick quote to get started.
If you have any questions or concerns, please call us at 800.724.5523 or email info@cnsinsures.com.